How to Use a Bet Tracker to Improve Your Win Rate (Step-by-Step Tutorial)
Introduction: From Data to Dollars
You understand that tracking your bets is important. You've read about the benefits, seen the statistics, and maybe even dabbled with a spreadsheet. But now you're ready to get serious.
The question is: how do you actually use a bet tracker to improve your results?
This step-by-step tutorial will walk you through everything—from setting up your tracking system to interpreting the reports that will transform your betting. By the end, you'll know exactly how to turn raw data into a higher win rate and bigger profits.
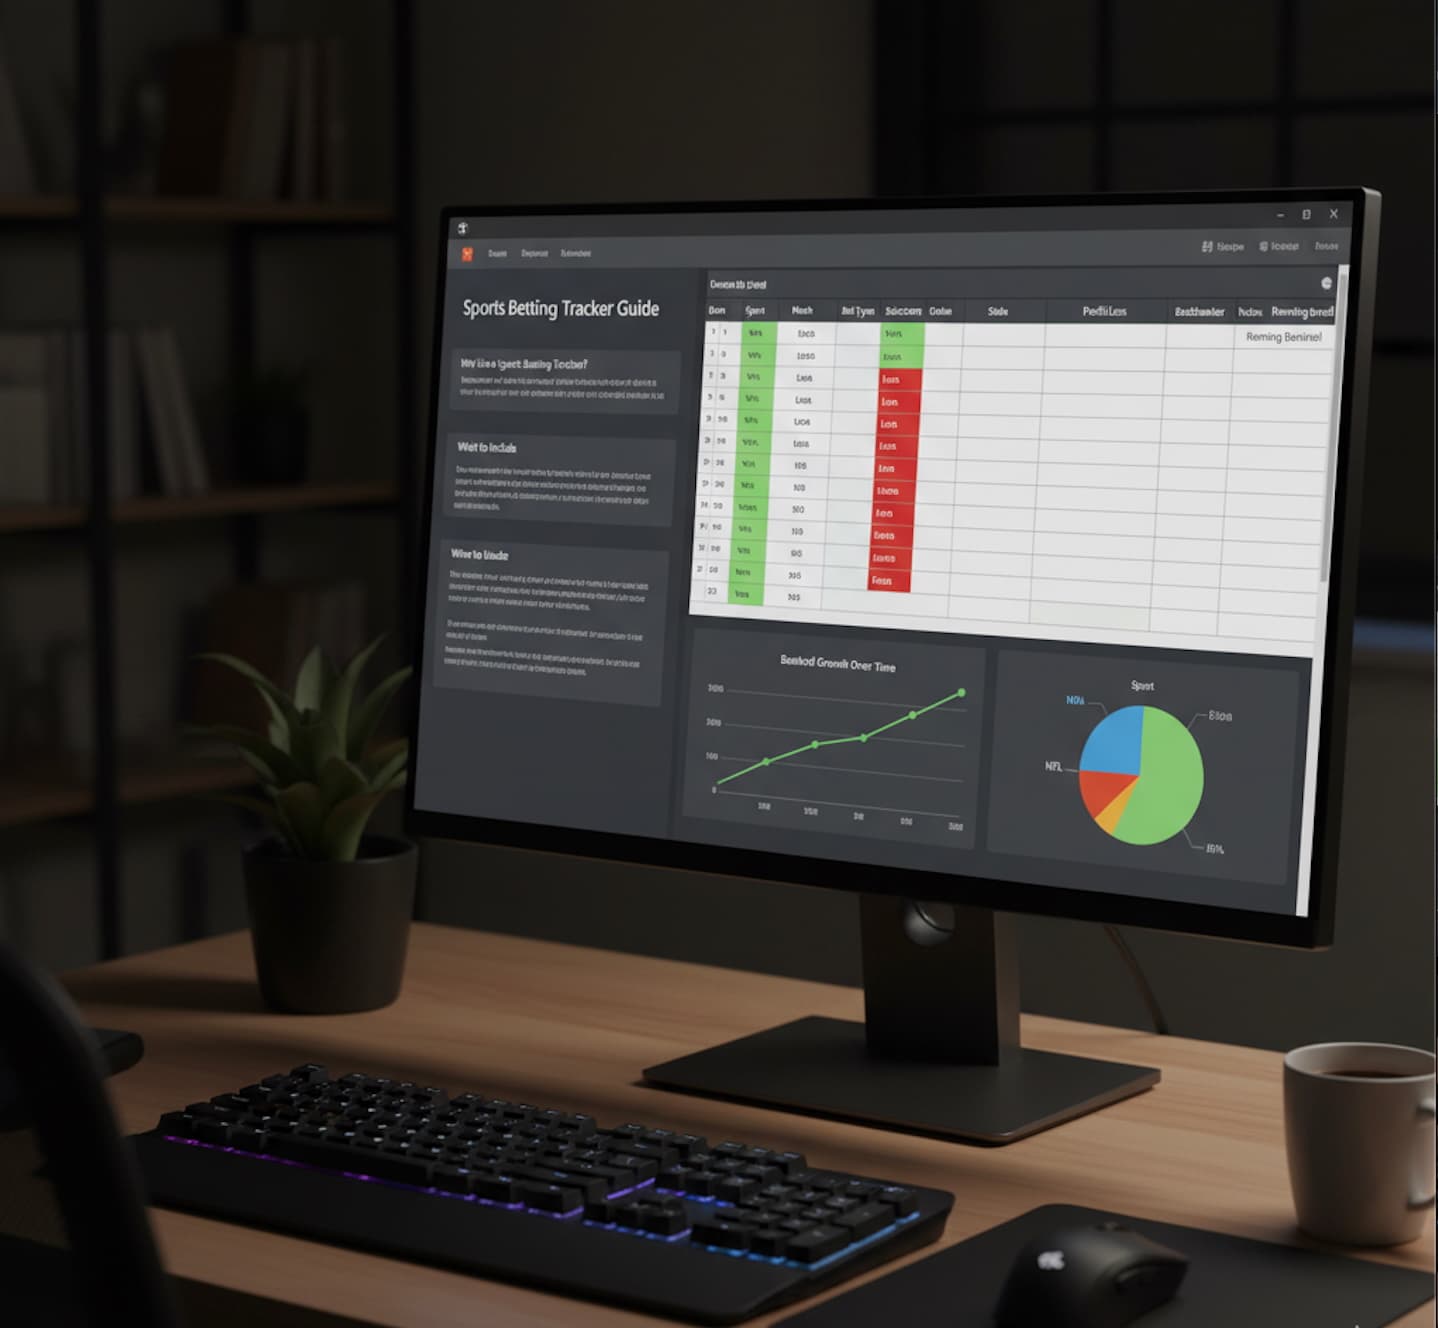
Whether you're using a dedicated app like mybets.gg or building your own system, these principles apply. Let's dive in.
Step 1: Choose and Set Up Your Bet Tracker
Option A: Using a Dedicated Bet Tracking App
Dedicated apps like mybets.gg are the fastest path to professional-grade tracking. Here's how to get started:
1. Create Your Account
Sign up and complete your profile:
Set your preferred currency
Define your unit size (we'll cover this in detail later)
Configure notification preferences
Connect any sportsbook accounts if supported
2. Customize Your Categories
Most apps allow you to customize tracking categories:
Sports: Add the sports you bet on
Leagues: Include specific leagues and conferences
Bet Types: Moneyline, spread, total, props, parlays, etc.
Tags: Create custom tags for tracking specific strategies
3. Set Your Baseline
Enter your starting bankroll and any historical data you have. This establishes your tracking baseline.
Option B: Building a Spreadsheet Tracker
If you prefer spreadsheets, here's a basic structure:
Required Columns:
Date
Sport/League
Teams/Game
Bet Type
Selection
Odds (American/Decimal)
Stake (Amount)
Units
Result (Win/Loss/Push)
Profit/Loss
Notes
Formula Columns to Add:
Running bankroll total
Cumulative ROI
Win rate percentage
Sport-specific profit/loss
Step 2: Establish Your Data Entry Workflow
The Golden Rule: Log Before the Game
Never wait until after a game to log your bet. Here's why:
Memory fades: You'll forget details, especially after multiple bets
Selective recall: It's easy to "forget" losing bets
Line accuracy: You need to record the odds you actually got
Best Practice: Log each bet within 5 minutes of placing it.
What to Record for Every Bet
Essential Information:
Date and Time
When you placed the bet
Game date and time
Game Details
Sport and league
Teams/players involved
Home/away designation
Bet Specifications
Bet type (spread, moneyline, total, prop, etc.)
Your selection
The line/odds you received
Financial Details
Amount wagered
Units (if using unit-based betting)
Potential payout
Line Information
Opening line (if you track it)
Your line/odds
Closing line (update after game starts)
Context and Notes
Why you made this bet
Confidence level (1-5 scale)
Any relevant situational factors
Creating a Data Entry Routine
Before Each Betting Session:
Open your tracker
Review any open bets
Check recent performance
During Betting:
Place your bet at the sportsbook
Immediately log it in your tracker
Add brief notes on your reasoning
After Each Game:
Update results as soon as games finish
Record closing lines if you didn't get them earlier
Add any post-game observations
Step 3: Master the Key Metrics
Understanding Your Dashboard
Most bet trackers display key metrics on a dashboard. Here's what to focus on:
Primary Metrics (Check Daily):
Current Bankroll
Your available betting funds
Running total including open bets
Session/Daily P&L
Today's profit or loss
Helps you know when to stop
Open Bets
Amount at risk
Number of pending wagers
Secondary Metrics (Review Weekly):
Overall ROI
Your return on investment percentage
The most important long-term metric
Win Rate
Percentage of bets won
Context matters (consider odds)
Units Won/Lost
Performance in betting units
Normalizes for bankroll size
How to Calculate Key Metrics Manually
Even with automated tracking, understanding the math helps:
Win Rate:
Win Rate = (Number of Wins / Total Bets) × 100
ROI:
ROI = (Net Profit / Total Amount Wagered) × 100
Units Won:
Units Won = Net Profit / Unit Size
Closing Line Value (CLV):
CLV = ((Your Odds - Closing Odds) / Closing Odds) × 100
(For American odds, convert to implied probability first)
Step 4: Analyze Your Performance Data
The Weekly Review Process
Set aside 30 minutes every week (Sunday evening works well) for a performance review:
1. Check Your Overall Numbers
Total profit/loss for the week
Win rate
ROI
Compare to previous weeks
2. Sport-by-Sport Breakdown
Look at each sport separately:
Which sports were profitable?
Which lost money?
Any surprising results?
3. Bet Type Analysis
Review performance by bet category:
Moneylines
Spreads
Totals
Props
Parlays
Teasers
4. Closing Line Value Check
This is crucial:
Are you beating the closing line consistently?
Which sports/bet types show the best CLV?
Where are you losing CLV?
The Monthly Deep Dive
Once per month, conduct a more thorough analysis:
1. Trend Identification
Look for patterns over time:
Are you improving or declining?
Any seasonal patterns?
How do you perform in different months?
2. Stake Size Analysis
Review your betting sizes:
Are you consistent with unit sizing?
Any emotional stake increases?
Correlation between stake size and results
3. Confidence Level Correlation
If you rate your picks:
Do your 5-star picks perform better than 3-star?
Should you adjust your rating system?
Are you overconfident in certain areas?
4. Situational Review
Analyze specific situations:
Day of week performance
Time of day patterns
Rest advantages/disadvantages
Home vs. away betting
Step 5: Interpret Your Tracking Reports
Understanding Common Report Types
1. Performance Summary Report
Shows overall results:
Total bets
Win/loss record
Net profit/loss
ROI percentage
What to Look For:
Positive ROI is the goal (3-7% is excellent)
Consistent results beat volatile big wins
Compare to your goals
2. Sport Breakdown Report
Results organized by sport:
Profit/loss per sport
Win rate by sport
ROI by sport
What to Look For:
Your strongest and weakest sports
Sports that might need more focus or should be eliminated
Opportunities to specialize
3. Bet Type Report
Analysis by wager type:
Spread performance
Moneyline results
Total betting outcomes
Prop bet profitability
What to Look For:
Which bet types suit your skills
Areas where you're consistently losing
Potential edges to exploit
4. Closing Line Value Report
Shows your CLV performance:
Overall CLV percentage
CLV by sport
CLV by bet type
Trend over time
What to Look For:
Positive CLV indicates you're beating the market
Consistent positive CLV predicts future success
Negative CLV suggests you need to improve timing
Red Flags to Watch For
1. Declining CLV
If your CLV is trending down:
You might be betting too close to game time
The market is adjusting to your edges
Consider betting earlier or finding new angles
2. Increasing Stake Sizes During Losing Streaks
This is classic tilt behavior:
Check if your average stake increases after losses
Implement strict unit sizing rules
Consider a cooling-off period after bad days
3. Poor Performance in "Confident" Picks
If your high-confidence picks lose more than low-confidence:
Your confidence assessment is flawed
You might be overvaluing certain information
Reconsider how you evaluate picks
4. Sport-Specific Struggles
If one sport consistently loses money:
Consider eliminating it from your portfolio
Or reduce stakes significantly
Focus resources on profitable areas
Step 6: Make Data-Driven Adjustments
How to Act on Your Analysis
Scenario 1: Strong CLV, Poor Results
This is actually a good position:
Your process is sound
You're just experiencing variance
Stay the course—results will follow
Scenario 2: Weak CLV, Good Results
This is concerning:
You've been lucky
Results will likely regress
Focus on improving your timing and analysis
Scenario 3: Strong Sport A, Weak Sport B
Clear action items:
Increase volume in Sport A
Decrease or eliminate Sport B
Analyze what makes Sport A successful
Scenario 4: Inconsistent Unit Sizing
Discipline issue:
Implement strict unit rules
Set maximum bet sizes
Review before each betting session
Creating Your Improvement Plan
Based on your analysis, create specific action items:
Example Plan:
Increase: NBA player props volume (currently +12% ROI)
Decrease: NFL totals (currently -8% ROI)
Maintain: MLB moneylines (+5% ROI, good CLV)
Improve: Closing line value on NBA spreads (currently -1%)
Fix: Unit sizing consistency (variance too high)
Step 7: Advanced Tracking Techniques
Tracking Your Betting Models
If you use models or systems:
Create Model-Specific Tags:
Tag each bet with the model used
Track model-specific ROI
Compare model performance
Example Tags:
"Model_A_v2.1"
"Contrarian_System"
"Line_Movement_Alert"
Situational Tracking
Add context to identify edges:
Rest Tracking:
Days of rest for each team
Back-to-back situations
Extended rest periods
Travel Tracking:
Time zone changes
Road trip legs
Travel distance
Injury Tracking:
Key players in/out
Injury report timing
Line movement correlation
Line Shopping Analysis
Track which sportsbooks you use:
Record for Each Bet:
Which sportsbook
The odds received
Closing odds at that book
Analyze:
Which books offer best lines consistently
Impact of line shopping on ROI
Books to avoid or use more
Best Practices for Long-Term Success
Consistency Is Everything
The value of tracking comes from consistent data:
Log every bet: No exceptions
Use consistent categories: Don't change definitions mid-stream
Review regularly: Weekly and monthly analysis
Be honest: Accurate data leads to accurate insights
Avoid Common Pitfalls
1. Over-Optimization
Don't change your strategy after every losing week:
Use meaningful sample sizes (100+ bets minimum)
Look for sustained trends, not short-term variance
Give adjustments time to work
2. Ignoring Sample Size
Small samples lead to false conclusions:
20 bets isn't enough to evaluate a sport
50 bets is barely a start
100+ bets needed for meaningful analysis
3. Analysis Paralysis
Don't track so much that you can't see patterns:
Focus on actionable metrics
Start simple, add complexity gradually
Quality of analysis beats quantity of data
4. Emotional Tracking
Don't let emotions affect data entry:
Record facts, not feelings
Don't inflate odds or forget losses
Be objective about your performance
Real-World Example: A Bettor's Transformation
Month 1: Baseline Establishment
Bettor: Jason, recreational NBA bettor Initial Approach: Betting 2-3 games per night based on "feel" Results: -$450, no tracking
Action: Started using mybets.gg to track all wagers
Month 2: Data Collection
Tracking Revealed:
48% win rate overall
-5% ROI
Strong on player props (+8%)
Terrible on totals (-15%)
Inconsistent unit sizing (0.5 to 3 units)
Month 3: First Adjustments
Changes Made:
Eliminated totals betting
Focused on player props
Implemented strict 1-unit sizing
Started line shopping
Results:
+2% ROI
More consistent results
Reduced variance
Month 4-6: Refinement
Continued Tracking Showed:
Props remained profitable
Specific player types performed better
Morning lines had better CLV
Further Adjustments:
Specialized in specific prop types
Started betting earlier in the day
Created player-specific models
Final Results (6 Months):
+7% ROI
Consistent monthly profits
Clear understanding of edge
Sustainable betting approach
Troubleshooting Common Issues
Problem: Forgetting to Log Bets
Solutions:
Set phone reminders during game times
Log immediately after placing bet (before game starts)
Use app notifications if available
Make it part of your betting ritual
Problem: Inconsistent Categorization
Solutions:
Create clear category definitions
Use dropdown menus instead of free text
Review categories monthly
Document your categorization rules
Problem: Not Understanding the Data
Solutions:
Start with basic metrics (win rate, ROI)
Learn one new metric per month
Read educational content on betting analytics
Join communities to discuss tracking
Problem: Data Overload
Solutions:
Focus on 3-5 key metrics initially
Use dashboard views, not raw data
Set up automated reports
Filter out noise, focus on signal
Conclusion: Your Path to Better Betting
Using a bet tracker effectively isn't complicated, but it does require discipline and consistency. The seven steps outlined in this tutorial provide a clear roadmap:
Set up your tracker properly with the right categories
Establish a data entry workflow that ensures accuracy
Master the key metrics that matter most
Analyze your performance regularly and thoroughly
Interpret tracking reports to identify patterns
Make data-driven adjustments to improve results
Apply advanced techniques as you gain experience
Remember, the goal isn't perfect tracking—it's actionable insights. Start simple, be consistent, and let the data guide your improvement.
Your win rate won't improve overnight, but with proper tracking and analysis, it will improve. And that's the difference between recreational betting and serious sports betting.
Start Tracking Smarter Today
Ready to put these techniques into practice? mybets.gg provides everything you need to track bets effectively—from automated data entry to advanced analytics dashboards. Start your journey to better betting today.
[Try mybets.gg Free and Start Improving Your Win Rate →]
Written by the Mybets.gg Team
Our team of sports betting analysts, data scientists, and professional bettors working together to bring you the most accurate strategies and insights. We combine data-driven analysis with real-world experience.